2026: Volume 7, Issue 1
Current Issue
 Abstract
  PDF
PDFAdaptation of the Score of Neonatal Acute Physiology-perinatal Extension II (SNAP-PE II) for Use in Resource-limited Settings
Irene E. Akhigbe1*, Sylvester O. Alikah1, Sylvia C. Olomu1, Andrew O. Eigbedion1, Lilian O. Akerele1, George O. Akpede1
1Department of Paediatrics, Irrua Specialist Teaching Hospital, Irrua, Edo State, Nigeria
*Corresponding author: Irene Eseohe Akhigbe, MBBS, FWACP, Consultant Paediatrician and Neonatologist, Phone: +2348027121431, E-mail: [email protected]
Received Date: January 17, 2026
Publication Date: March 17, 2026
Citation: Akhigbe IE, et al. (2026). Adaptation of the Score of Neonatal Acute Physiology-perinatal Extension II (SNAP-PE II) for Use in Resource-limited Settings. Neonatal. 7(1):31.
Copyright: Akhigbe IE, et al. © (2026).
ABSTRACT
Background and Objectives: The widespread adoption of neonatal mortality risk assessment scores in triage of the ill newborn could greatly reduce the unacceptably high neonatal mortality in resource-limited countries especially those in sub-Saharan Africa. In spite of this potential, however, their use has not been established in the region due mainly to the invasive nature of some of the methods involved and the high cost of deployment of blood gas analyzers. We carried out this study to obviate these drawbacks by developing a simplified scoring system with minimally invasive methodologies. Method: We developed the Simplified Neonatal Acute Illness Severity Score (SNAISS) by adaptation of the Score of Neonatal Acute Physiology Perinatal Extension II (SNAP-PE II) through substitution of the arterial blood gas variables with hematocrit and peripheral oxygen saturation. We then evaluated the discriminant ability and calibration of SNAISS for adverse outcomes among 135 babies using receiver operator characteristic (ROC) curve and Hosmer-Lemeshow goodness of fit  test. We also assessed the relationship between outcome and SNAISS using Cramer’s V. Results: The area under ROC curve for the plot of outcome versus SNAISS was 0.926 and the Hosmer-Lemeshow goodness of fit 1.00 while the Cramer’s V for the relationship between SNAISS and neonatal outcome was 0.798. Conclusion: SNAISS has an excellent discrimination for adverse neonatal outcome, with a direct relationship between the scores and the risk of death. We recommend it as a readily available tool for use in clinical practice in resource-limited settings.
Keywords: Neonatal Mortality; Risk Assessment; Adapted Score of Neonatal Acute Physiology Perinatal Extension II; Simplified Neonatal Acute Illness Severity Score.
INTRODUCTION
Many neonatal deaths are preventable and the reduction of neonatal mortality could be achieved by a two-pronged approach, addressing the common causes of neonatal deaths through prevention and optimizing the care of seriously ill babies [1,2]. The latter underscores the need for clinical tools for determining illness severity and mortality risk [2]. In this regard, scoring systems have been developed, which aggregate the physiological parameters that reflect the initial clinical state of the newborn on presentation and admission for the purpose of predicting illness severity and mortality [1]. The use of such scoring systems enables the comparison of mortality rates between Neonatal Intensive Care Units (NICUs) through adjustment for illness severity at admission. In addition, scoring systems are relevant in the triage of patients, which can enable maximization of limited resources, especially in resource poor settings [1]. Furthermore; they are also of value in explaining the probable outcome and cost of treatment to parents [3].
The complexity, ease of use and predictive ability of scoring systems vary [2] but among the available scoring systems, the Score of Neonatal Acute Physiology Perinatal Extension II (SNAP-PE II) [1] had been considered the best owing to its simplicity, rapidity, accuracy of use and applicability to babies of all birth weight categories [4]. The more recently developed neonatal mortality score-9 Mexico (EMN-9 Mex) [5] has similar attributes.
The use of SNAP-PE II, [1] or the more recent Mexican score [5], could be quite impactful in the effort at reducing neonatal mortality in resource-limited countries, many of which are in sub-Saharan Africa, Asia and South and Central America. However, the scores [1,5] have serious inherent drawbacks, which may be why they have not been widely adopted for use, for example, in the West African sub-region. These drawbacks include the high cost of procuring and maintaining blood gas analyzers plus a lack of the requisite expertise for arterial blood sampling in many of our neonatal units [6,7]. Apart from these drawbacks, blood gas analysis (BGA), a component of both SNAP-PE II [1] and EMN-9 Mex [2], requires arterial puncture, an invasive procedure which can sometimes have significant attendant complications such as hematoma formation and gangrene of limb extremity even when appropriate precautions have been taken [8]. The reality of these risks raises ethical concerns as to the wisdom in subjecting non-critically ill infants to a potentially harmful procedure, the results of which may not necessarily influence the subsequent management. These issues prompted us to develop a simplified scoring system, particularly one which requires minimally invasive methodologies and obviates the need for expensive technologies, the Simplified Neonatal Acute Illness Severity Score, SNAISS.
SNAP-PE II [1] and EMN-9 Mex [5] have comparable abilities for predicting neonatal mortality in both high and low risk populations and both are well calibrated with an area under receiver operator characteristic (ROC) curve of 0.91 and 0.92, respectively. However, while the multi-center nature in the development of SNAP-PE II and limited effect of selection bias could allow for the generalization of the results to similar populations of babies in other NICUs globally [1,9], this may not be so for EMN-9 Mex [5]. This is owing to its relatively small sample size, development from a target population restricted to a single center, and limitation of the prognostic power of the score to the early neonatal period [5]. The predictive accuracy of SNAP-PE II has also been confirmed in several studies in other populations such as those of India [9], Indonesia [10], Iran [11]. These considerations informed our choice of SNAP-PE II for adaptation and modification in our study.
METHOD
We first conducted a literature review to determine the feasibility of adaptation of SNAP-PE II through its modification, and then carried out a prospective cross sectional study at the Neonatal Unit, Department of Paediatrics, Irrua Specialist Teaching Hospital (ISTH), Nigeria, to validate the predictive ability of the modified scoring system. Our Neonatal Unit has an In-born section for babies delivered at the ISTH and Out-born section for referrals from other health care facilities, or ‘self-referrals’ from home. An average of 500 babies is admitted annually to the Unit.
Development of SNAISS from SNAPE-PEII
We set out to adapt SNAP-PE II score1 through substitution of the requirement for determination of arterial blood gas variables (PaO2/FiO2 ratio and serum pH) with measurement of (SpO2). We could do this drawing from the direct relationship between the blood gas variables, partial pressure of oxygen in arterial blood/fractional inspired oxygen (PaO2/FiO2 ratio) and serum pH, and oxygen saturation (SpO2) [12,13]. We also substituted the need for direct assessment of hemoglobin concentration with measurement of the hematocrit [14], which could be done rapidly in a side room laboratory. Both PaO2/FiO2 ratio and PaO2 are clinical indicators of blood oxygenation [12,13], but while PaO2 is an indicator of gaseous exchange in the lungs, SpO2 is a more useful determinant of the availability of oxygen to the tissues [13]. The value of arterial oxygen concentration (CaO2) is a product of PaO2 or SpO2 and hemoglobin concentration or hematocrit. [13]. The Bohr effect enables SpO2 readings to retain its value as a true reflection of the amount of oxygen bound to hemoglobin independent of serum pH [13]. SpO2 was also the variable used in the Transport Risk Index of Physiology Stability score (TRIPS) [15] and hematocrit in the Score of Neonatal Acute Physiology (SNAP) [16].
We hypothesized that determination of SpO2 could be a suitable alternative to measurement of PaO2/FiO2 in view of the direct relationship between them [12]. We also hypothesized that the direct relationship between pH and SpO2 enables the measurement of the latter to serve as a substitute with serum pH [13]. The use of SpO2 and hematocrit has obvious advantages in resource-poor settings. Besides this, SpO2 is known to be more useful in CaO2 in determining the availability of oxygen in the tissues [13].
We assigned scores for the lowest SpO2 and hematocrit as in TRIPS [15] and SNAP [16], respectively while we retained the scores for the other parameters as in SNAP-PE II [1].
Validation of SNAISS
We conducted the validation arm of our study between January 2017 and March 2017 during which period 152 newborn babies were admitted to our Neonatal Unit. Among them, 135 babies (88.8%) were included in the study and 17 (11.2%) excluded because of non-consenting parents (n = 6) and uncertainty as to the Apgar scores and birth weight (n = 11). We had no babies with severe congenital malformations such as anencephaly that were incompatible with life or who died within the first 12 hours of admission. [The babies earmarked for exclusion from the study had otherwise included: deaths within 12 hours of admission as data collection period <12 hours could diminish data quality and predictive accuracy [1]; babies with severe congenital malformations such as anencephaly that are incompatible with life because the associated mortality/morbidity risks cannot be predicted using SNAP-PE II scores [1,17]; unsupervised home deliveries as the Apgar scores and/or birth weight could not be ascertained; babies whose gestational age could not be determined because admitted after 7 post-natal days, or mother has no known last menstrual period or had no ultrasound scan dating; and babies admitted after 72 hours of life from referral centers where birth weight cannot be adequately verified or authenticated.]
We administered SNAISS within 12 hours of admission to reduce the impact of hospitalization and treatment on the scores [1]. The administration was carried out by one of us (I.E.A) and three research assistants who were Senior Registrars in our department who had been trained for the purpose of the study. The data extracted for each baby was entered into the proforma designed for the study.
We used birthweights obtained within 72 hours of delivery [18]. For babies delivered at our hospital or referred to us within 72 hours of delivery, we measured weights to the nearest 0.1g, using a Beurer digital electronic scale (Model BT-80, Serial No. 4211125, manufactured by Beurer GmbH, Hampfergasse Ulm, Germany) with the baby completely unclothed. Where available, we used the birth weights documented in the referral notes for babies admitted after 72 hours of life. We assessed gestational age using the date of the last menstrual period (Naegele’s rule) [19] where the mother could provide this information or the result of the first trimester ultrasonography [19] where the mother was unable to and used the New Ballard score [20] where neither of these information was available. We used WHO’s fetal-infant growth charts [21] to determine the appropriateness of birth weight for gestational age (WFGA) as follows: small for gestational age (WFGA <10thcentile), appropriate-for-gestational age (WFGA between the 10th and 90th centiles, and large-for-gestational age (WFGA >90th centile) [21].
We measured the blood pressure of babies on admission, and 6hourly thereafter within the first 12 hours of admission, using the CONTEC08A digital neonatal monitor (Model CONTEC08A, Serial No. 1511100438, manufactured by Contec Medical Systems Co. Ltd, Hebei Province, China) which uses the oscillometric method [22]. An appropriate sized cuff that covered at least two thirds of the right upper arm circumference (and did not extend over a joint), was applied and the baby left undisturbed for at least 15 minutes, or until the infant was sleeping or in a quiet awake state, before the blood pressure was taken [23] and we used the lowest mean arterial pressure (MAP) from the three 6hourly readings in analysis [1].
We also measured peripheral oxygen saturation (SpO2) on admission, and 6hourly thereafter for the first 12 hours using a portable Mindray digital pulse oximeter (Model PM-60, Serial No. ADA49234419, manufactured by Mindray Bio-Medical Electronics Co. Ltd, Shenzhen, China). The measurements were carried out in room air, using the right foot to ensure uniformity. We also used the lowest of the three readings in analysis [15].
We determined the hematocrit of babies on admission using capillary blood samples collected from heel prick into heparinized capillary tubes. One end of the capillary tube was sealed using plasticine and spun in a Spin Force-T microhematocrit centrifuge (Model KHT-400, Serial No. 1517423, manufactured by Gemmy Industrial Corp, Taiwan) at 5000rpm for 5 minutes in the Unit’s side-room laboratory attached to the Neonatology Unit. We measured urine output 6 hourly in the first 12 hours on admission using an SRScales peewee device (Model SR310, Serial No. CA300FD, manufactured by SR Intruments, Inc. Tonawanda, NY, USA with accuracy of ±2 grams) with 1g difference in weight between the wet and dry diapers equal to 1ml of urine and computed the total urine output over the 1st 12hours in ml/kg/hour.
We obtained information on the Apgar score at five minutes from the baby’s medical record, monitored the core temperature hourly for the 1st 12 hours on admission and also observed the baby for the presence or absence of multiple clinical seizures including apnea during the 1st 12 hours. We assigned scores for each baby’s birth weight, appropriateness of birth weight for gestational age, Apgar scores, presence of multiple seizures, urine output, lowest MAP and lowest temperature as described earlier (vide supra) and computed the final scores as the arithmetic sum of the individual scores of the parameters.
Management of the acutely ill babies involved in the study
All babies admitted into the Neonatal Unit as a matter of practice, are evaluated by taking a detailed history and clinical examination, followed by laboratory and/or radiological investigation as indicated, to identify the medical problems of the newborn. A treatment order is clearly written to address these medical needs, while the baby is monitored to assess response to treatment and complications that may arise from treatment or progression of the disease in line with internationally accepted Standard Operating Procedure (SOP). The process of evaluation and management of all admitted newborns are done by a team of doctors amongst whom are consultant neonatologists, senior and junior paediatric residents as well as medical interns, with the support of paediatric nurses and other health workers.
Refusal to give consent for inclusion in the study did not in any way interfere with the management of the babies during admission, and those recruited did not receive less than optimal medical care, as the administration of scores did not interfere with the care given. However, the results obtained from the scoring of physiological parameters were used in the management of the babies.
Ethical Issues
Ethical clearance for the study was obtained from the Research and Ethics Committee of ISTH (HREC NO: ISTH/HREC/2015/AUGUST/003). Written informed consent was obtained from the parents and/or guardians of the babies.
Data Analysis
We classified the neonatal outcomes dichotomously as died versus discharged, the former being babies who did not survive admission and the latter while were those that survived their hospital stay and were thereafter followed up as outpatients. In addition, we also classified the babies based on the final SNAISS scores into low risk (total scores <40), high-risk (scores ≥40-79) and very high-risk (scores ≥80) as for SNAP-PE II [9].
We used the Statistical Package for Social Sciences (SPSS) [24] version 17.0 in data analysis. We determined the association between SNAISS risk categories and outcome using Fisher’s exact test while the correlation between SNAISS scores and outcome was determined using Cramer’s V test for association with zero taken as indicative of the absence of a relationship, <0.2 a weak relationship, 0.2-0.3 moderate relationship, and >0.3 a strong relationship [25]. We statistically validated the predictive ability of SNAISS for mortality by using the area under the ROC curve to determine its discriminative ability for death [26] and Hosmer-Lemeshow goodness of fit chi-square test to assess the calibration [27].
RESULTS
We show the derived simplified scores, SNAISS in Table 1 and a comparison of SNAP-PE II and SNAISS in Table 2. The two scores were comparable except with respect to the maximum attainable scores, which is lower with SNAISS (Table 2).
Table I: Simplified Neonatal Acute Illness Severity Score, SNAISS
|
Variable |
Status |
Score |
|
Lowest Mean arterial press, mmHg |
>29 |
0 |
|
|
20-29 |
9 |
|
|
<20 |
19 |
|
Lowest core temperature, ?C |
>35.6 |
0 |
|
|
35.0-35.6 |
8 |
|
|
<35.0 |
15 |
|
Birthweight, grams |
>999g |
0 |
|
|
750-999 |
10 |
|
|
>750 |
17 |
|
Small for gestational age |
No |
0 |
|
|
Yes |
12 |
|
Urine output, ml/Kg/hour |
>0.9 |
0 |
|
|
0.1-0.9 |
5 |
|
|
<0.1 |
18 |
|
Respiratory status, O2 saturation % |
≥85 |
0 |
|
|
<85 |
5 |
|
|
Apnea, gasping, intubated |
14 |
|
Hematocrit, % |
36-65 |
0 |
|
|
66-70, 30-35 |
1 |
|
|
>70; 20-29 |
3 |
|
|
<20 |
5 |
|
Multiple seizures |
No |
0 |
|
|
Yes |
19 |
|
Apgar score at 5 minutes |
≥7 |
0 |
|
|
<7 |
18 |
Table 2: Comparative analysis of SNAP-PE II and SNAISS
|
Characteristic |
SNAP-PE II |
SNAISS |
Remarks |
|
Total no. of items in the score |
9 |
9 |
Comparable |
|
No. of sub-items in the score |
25 |
25 |
Comparable |
|
Minimum – maximum total score |
0– 162 |
0– 137 |
Comparable, except for a lower maximum SNAISS score |
|
Maximum total score |
162 |
137 |
- |
|
Items in the score |
Mean BP, core temperature, PaO2/FiO2, serum pH, multiple seizures, urine output, BW, appropriateness of BW for GA, Apgar score at 5 minutes |
Mean BP, core temperature, SpO2, hematocrit, multiple seizures, urine output, BW, appropriateness of BW for GA, Apgar score at 5 minutes |
PaO2/FiO2 and serum pH in SNAP-PE II substituted with SpO2 in SNAISS; hematocrit included in SNAISS but not SNAP-PE II |
|
Mortality risk categories |
Low, high, very high |
Low, high, very high |
Comparable |
BW = birth weight; GA = gestational age; Mean BP = mean blood pressure.
Table 3: Morbidities and related mortalities among the 137 babies involved in the validation of SNAISS
|
Major morbidities |
N (%)* |
Mortality No. (%)** |
|
|
Neonatal jaundice |
51 (37.8) |
1 (2.0) |
|
|
Neonatal sepsis |
39 (28.8) |
2 (5.1) |
|
|
Prematurity |
21 (15.6) |
6 (28.6) |
|
|
Birth asphyxia |
10 (7.4) |
8 (80.0) |
|
|
Miscellaneous |
14 (10.4) |
1 (7.1)# |
|
|
Total |
135 (100.0) |
18 (13.1) |
*Percentages add downwards
**Percentages add across
#Had pneumonia
We show the plot of the receiver operator characteristic (ROC) curve of the relationship between final SNAISS scores and outcome in Figure 1. The area under the curve (AUC) of the ROC was 0.926 while the Hosmer-Lemeshow goodness of fit p was 1.00.
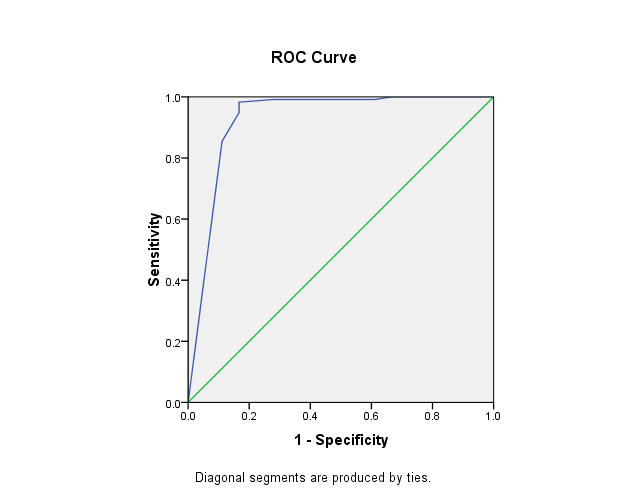
Figure 1: Plot of Receiver Operator Characteristic for the relationship between total SNAISS scores and outcome, death versus survival.
In Table 4, we further show the calibration of SNAISS in terms of the ratio of observed to expected number of deaths for the different ranges of SNAISS scores while in Figure 2 we show the overall relationship between SNAISS score risk category and the risk of death. The ratio of observed to expected number of deaths was 1.0 in all cases of the different ranges of SNAISS scores, except in the 20-29 score ranges where there was no death (Table 4). The mean ± SD of SNAISS scores was 26 ± 2.0 and the range 0 – 118. One hundred and twenty-one babies (89.6%) were low risk, 8 (5.9%) high risk and 6 (4.5%) very high risk.
Cramer’s V for the correlation between final SNAISS scores and neonatal outcome was 0.798 while neonatal mortality had a highly significant (p <0.001) direct relationship with SNAISS scores risk category (Figure 2). Mortality was 5/121 (4.1%) among low risk, 7/8 (87.5%) among high risk and 6/6 (100.0%) among very high risk babies (OR (95% CI) of death in high versus low risk babies = 162.4 (16.64, 1585.5), p<0.001) and high risk plus very high risk (13/14) versus low risk = 301.6 (32.69, 2783.0); OR undefined, p<0.001 for very high risk versus low risk and OR undefined, p>0.999 for very high risk versus high risk).
Table 4: Calibration of SNAISS using Hosmer-Lemeshow goodness of fit test.
|
SNAISS scores |
No. of babies |
Observed no. of deaths |
Expected no. of deaths |
Ratio of observed/expected no. of deaths |
|
0-9 |
102 |
2 |
2 |
1.00 |
|
10-19 |
12 |
1 |
1 |
1.00 |
|
20-29 |
4 |
0 |
0 |
Not applicable |
|
30-39 |
3 |
2 |
2 |
1.00 |
|
40-49 |
4 |
4 |
4 |
1.00 |
|
50-59 |
1 |
1 |
1 |
1.00 |
|
60-69 |
1 |
1 |
1 |
1.00 |
|
70-79 |
2 |
1 |
1 |
1.00 |
|
≥80 |
6 |
6 |
6 |
1.00 |
|
Overall |
135 |
18 |
18 |
1.00 |
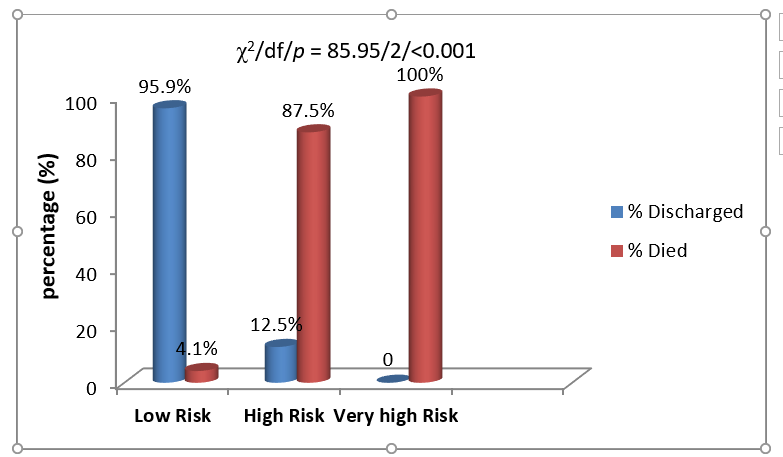
Figure 2: Relationship between SNAISS scores risk category and neonatal mortality
DISCUSSION
We have developed from SNAP-PE II and validated a simplified neonatal illness severity score (SNAISS) that could be suitable for use in health settings of LMICs, particularly those in sub-Saharan Africa but SNAISS might also find a place even in high-income countries. This is in as much as the direct relation between SNAISS and neonatal mortality is similar to that between SNAP-PE II and neonatal mortality [1]. SNAISS also demonstrated a strong correlation with neonatal outcome (Cramer’s V = 0.798), an excellent discrimination (AUC of ROC = 0.926) and an extremely good calibration (goodness of fit p = 1.00). These results demonstrate that SNAP-PE II can be successfully modified for use in resource-poor settings without loss of the predictive ability of SNAP-PE II including applicability in the early course of hospitalization, ability to predict mortality risk categories, and usefulness for all neonates [1,3] while at the same time made advantaged by way of ease of use.
The extremely good fit of SNAISS (1.0) is comparable to the 0.9 & 0.97 obtained in previous studies using SNAP-PE II [1,4] and implies that SNAISS is at least as good as SNAP-PE II in predicting neonatal mortality. Our results also show that SNAISS has an excellent discrimination (0.926), which is comparable to the discrimination of other physiology-based intensive care unit scores which range from 0.80 to 0.90 [28-32] and comparable to the range of 0.90 and 0.933 reported from previous studies of SNAP-PE II [1,4].
We propose that the excellent performance of SNAISS could be ascribed to its improved correlation with the adequacy of tissue oxygenation, an advantage conferred on it through incorporation of all the variables that are critical to determination of arterial oxygen concentration and thus neonatal mortality [3,13]. A similar experience was reported by Richardson et al in the development of SNAP II and SNAP-PE II from SNAP and SNAP-PE through removal of the physiological variables which were not significant predictors of death. The resultant simplified score was more predictive of neonatal mortality [1].
We substituted PaO2/FiO2 and serum pH with oxygen saturation (SpO2) and hemoglobin concentration with hematocrit in developing SNAISS. SpO2 is measurable using a readily available and considerably less expensive non-invasive method which requires minimal expertise. These are obvious advantages in resource-poor settings. The presence of hypoperfusion and hypotension which might limit its reliability could be mitigated by warming the extremities before the readings are taken [33]. Also, the trend shown on repeated assessment could still be helpful to the clinician in monitoring the patient, as SpO2 declines with worsening hypoperfusion [33].
The need for reductions in the cost of care without compromising the quality of care is appealing and of growing importance particularly in resource-poor but also in resource-rich countries [1,5,34]. In this regard, the simplicity, accuracy and predictive ability of SNAISS for neonatal mortality are notable and could make it a tool with practical relevance worldwide.
LIMITATIONS AND CONCLUSION
The absence of post term neonates in this study limits the conclusion drawn on the reliability of SNAISS in their assessment. Additionally, the sample size and target population are restricted to a single center limiting generalizability of study findings. It would therefore be worth validating SNAISS in a larger neonate population across different health facilities.
We conclude that SNAISS has excellent discrimination and calibration for adverse neonatal outcome that could give it comparative advantage over SNAP-PE II and EMN-9 Mex owing to its noninvasive nature, and use of readily available cot-side features and technology. We therefore recommend it as a suitable alternative to the extant scores.
ACKNOWLEDGEMENTS
We acknowledge the support of the other medical and nursing staff of the neonatal unit, Department of Paediatrics, Irrua Specialist Teaching Hospital, who participated in one way or another in the treatment of the patients reported upon in this paper.
Declaration of Conflict of Interest
The authors have no conflicts of interest to declare.
REFERENCES
- Richardson DK, Corcoran JD, Escobar GJ, Lee SK. (2001). SNAP-II and SNAPPE-II: Simplified newborn illness severity and mortality risk scores. The Journal of pediatrics. 138(1):92-100.
- Sara A, Brito JD, Matsuo T (2003). CRIB score, birth weight and gestational age in neonatal mortality risk evaluation. Revista de sau?de pu?blica. 37:2-10.
- Maiya PP, Nagashree S, Shaik MS. (2001). Role of score of neonatal acute physiology in predicting neonatal mortality. Indian Journal of Pediatrics .68(9):829-834.
- Thimoty J, Hilmanto D, Yuniati T. (2009). Score for neonatal acute physiology perinatal extension II (SNAPPE II) as the predictor of neonatal mortality hospitalized in neonatal intensive care unit. Paediatrica Indonesiana. 49(3): 155-159.
- Márquez-González H, Jiménez-Báez MV, Muñoz-Ramírez CM, Yáñez-Gutiérrez L, Huelgas-Plaza AC, Almeida-Gutiérrez E, et al. (2015). Development and validation of the Neonatal Mortality Score-9 Mexico to predict mortality in critically ill neonates. Archivos Argentinos de Pediatri?a.113(3):213-220.
- Cost of Abbott i-Stat 1 Arterial Blood Gas Analyser -Block Scientific Incorporated.
- Peripheral Arterial Access of the Neonate, in Neonatal Intensive Care.
- De Carolis MP, Bersani I, Piersigilli F, Rubortone SA, Occhipinti F, Lacerenza S, et al. (2014). Peripheral nerve blockade and neonatal limb ischemia: our experience and literature review. Clinical and Applied Thrombosis/Hemostasis. 20(1):55-60.
- Jain S, Bansal A. (2009). SNAPPE II score for predicting mortality in a level II neonatal intensive care unit. Dicle Medical Journal. 36:333-335.
- Mia RA, Etika R, Hariante A, Indarso F, Damanik SM. (2005). The use of SNAPPE II in predicting neonatal outcome in NICU. Paediatrica Indonesiana. 45(6):241-245.
- Kadivar M, Sagheb S, Bavafa F, Moghadam L, Eshrati B. (2007). Neonatal mortality risk assessment in a neonatal intensive care unit. Iran Journal of Pediatrics. 17(4):325–331.
- Allardet-Servant J, Forel JM, Roch A. (2009). FiO2 and acute respiratory distress syndrome definition during lung protective ventilation. Critical Care Medicine.37(1):202–207.
- Lawrence M. (1999). PaO2, SaO2 and oxygen content. In: All You Really Need to Know to Interpret Arterial Blood Gases. 2nd ed. Philadelphia: Lippincott Williams & Wilkins. Chapter 5.
- Billett HH. (1990). Hemoglobin and hematocrit. In: Walker HK, Hall WD, Hurst JW, editors. Clinical Methods: The History, Physical, and Laboratory Examination. 3rd ed. Boston: Butterworths. Chapter 151.
- Lee SK, Zupancic JA, Pendray M, Thiessen P, Schmidt B, Whyte R, et al. (2001). Canadian Neonatal Network. Transport risk index of physiologic stability: a practical system for assessing infant transport care. The Journal of pediatrics. 139(2):220-226.
- Richardson DK, Gray JE, McCormick MC, Workman K, Goldmann DA. (1993). Score for neonatal acute physiology: a physiologic severity index. Pediatrics.91(3):617-623.
- Synnes AR, Berry M, Jones H, Pendray M, Stewart S, Lee SK, et al. (2004). Infants with congenital anomalies admitted to neonatal intensive care units. American Journal of Perinatology. 21(4):199-207.
- Marchant T, Willey B, Katz J, Clarke S, Kariuki S, ter Kuile F, et al. (2012). Neonatal mortality risk associated with preterm birth in East Africa, adjusted by weight for gestational age: individual participant level meta-analysis. PLoS Med. 9(8):e1001292.
- Cloherty JP, Eichenwald EC, Stark AR. (2008). Identifying the high-risk newborn and evaluating gestational age. In: Manual of Neonatal Care. 6th ed. Philadelphia: Lippincott Williams & Wilkins. p.42–58.
- Ballard JL, Khoury JC, Wedig K, Wang L, Eilers-Walsman BL, Lipp R. (1991). New Ballard Score, expanded to include extremely premature infants. The Journal of Pediatrics. 119(3):417-423.
- World Health Organization. (1995). Physical status: the use and interpretation of anthropometry. WHO Technical Report Series 854. Geneva: WHO.
- CONTEC Medical Systems. CONTEC08A electronic sphygmomanometer operator’s manual.
- Nwankwo MU, Lorenz JM, Gardiner JC. (1997). A standard protocol for blood pressure measurement in the newborn. Pediatrics.99(1):1-4.
- SPSS Inc. (2008). SPSS Statistics for Windows, Version 17.0. Chicago: SPSS Inc.
- Cramér H. (1946). Mathematical Methods of Statistics. Princeton: Princeton University Press. Chapter 21.
- Van Erkel AR, Pattynama PM. (1998). Receiver operating characteristic analysis. European Journal of Radiology. 27(2):88-94.
- Hosmer DW, Lemeshow S (2000). Applied Logistic Regression. 2nd ed. New York: Wiley.p.147-156.
- Knaus WA, Wagner DP, Draper EA. (1991). The APACHE III prognostic system: risk prediction of hospital mortality for critically ill hospitalized adults. Chest.100(6):1619-1636.
- Lemeshow S, Le Gall JR. (1994). Modeling the severity of illness of ICU patients: a systems update. Journal of the American Medical Association. 272(13):1049-1055.
- Pollack MM, Patel KM, Ruttimann UE. (1996). PRISM III: an updated Pediatric Risk of Mortality score. Critical Care Medicine. 24:743–752.
- Pollack MM, Patel KM, Ruttimann UE. (1997). PRISM III-APS: a method of assessing physiologic instability. J Pediatrics.131(4):575-581.
- Pollack MM, Koch MA, Bartel DA. (2000). A comparison of neonatal mortality risk prediction models in very low birth weight infants. Pediatrics.105(5):1051-1057.
- Hanning CD, Alexander-Williams JM. (1995). Pulse oximetry: a practical review. British Medical Journal.311(7001):367-370.
- Saleem S, McClure EM, Moore J. (2008). Adverse neonatal and maternal outcomes in Pakistani hospitals. The International Journal of Gynecology & Obstetrics. 102:40-46.