2024: Volume 5, Issue 1
Past Issues
 Abstract
  PDF
PDFInfant Weight Faltering and Feeding Patterns at 6 Weeks Post Delivery in a Rural East African Community: Comparing Incremental Versus Static Weight Assessments
Adenike Oluwakemi Ogah1,*, James Aaron Ogbole Oluwasegun Ogah2, Elizabeth Edigwu Oluwaseun Ogah3, Phiri Chidongo4
Department of Pediatrics and Child Health, School of Medicine, University of Zambia, Lusaka, Zambia
UNZAMEDSA, University of Zambia, Lusaka, Zambia
School of Natural Sciences, University of Zambia, Lusaka, Zambia
School of Education, University of Zambia, Lusaka, Zambia
*Corresponding Author: Adenike Oluwakemi Ogah, PhD, Department of Pediatrics and Child Health, School of Medicine, University of Zambia, Lusaka, Zambia; Tell: +260764241999; Email: [email protected]
Received Date: January 31, 2024
Publication Date: March 15, 2024
Citation: Ogah AO, et al. (2024). Infant Weight Faltering and Feeding Patterns at 6 Weeks Post Delivery in a Rural East African Community: Comparing Incremental Versus Static Weight Assessments. Neonatal. 4(1):15.
Copyright: Ogah AO, et al. © (2024).
ABSTRACT
Background: The purpose of this study was to examine the prevalence and determinants of infant weight faltering and compare incremental with static weight assessments among 6 weeks old infants in a remote understudied village in East Africa. This was a secondary analysis of a prospective cohort study. Data of 512 out of the 529 mother- newborn pairs recruited from birth were obtained and analysed at 6 weeks post-delivery in the postnatal clinic. Records of infant feeding patterns and anthropometry were documented. Infant weight at birth and at 6 weeks were compared using the NICE criteria for both incremental/interval and static weight growth. Mothers were interviewed using the Edinburgh postpartum depression score to assess emotional status. Chi test and binary logistic regression model was used to examine the relationship between maternal/infant characteristics and infant weight growth. The results were presented in p-values, Odds ratio and 95% confidence interval. The similarity and dissimilarity between infant static and incremental weight assessments were measured using Kappa and McNemar tests respectively. Results: Overall, the incidences of static and incremental weight faltering at 6 weeks post-delivery were 3.1% (16 out of 512) and 1.4% (7 out of 512), respectively. The Cohen Kappa measure of agreement between the 2 methods of weight assessment, was moderate at 0.424 (p<0.001). Three out of the 512 infants were not exclusively breastfed; two of whom were offered water and 1 was fed with fresh cow milk. Exclusive breastfeeding rate was 99.4% at 6 weeks post-delivery in this cohort. A higher percentage of the SGA-born (compared to AGA and LGA) infants, 11 out of 107 (10.3%) were weight faltering according to static assessment. This was contrary to increment weight assessment, where a lower percentage of SGA-born [only two out of 107 (1.9%), compared to LGA] infants, were faltering. The LGA-born infant, according to incremental weight assessment, was the least likely to weight accelerate, compared to the SGA-born and AGA-born infants; OR 0.04; 95% CI 0.01, 0.10. High maternal depression score was associated with infant weight acceleration, p<0.001; OR 1.13; 95% CI 1.06, 1.21. Boys were less likely to weight accelerate compared to girls, p<0.001; OR 0.45; 95% CI 0.29, 0.70. Infants, who were adequately fed were more likely to weight accelerate compared to those, who were poorly fed, p<0.001; OR 2.80; 95% CI 1.55, 5.05. Infants, who did not fall ill since birth were more likely to weight accelerate compared to those who had fallen ill, p=0.004; OR 2.73; 95% CI 1.37, 5.43. Conclusion: This study emphasizes the importance of assessing infant growth using both static and incremental measures. Health workers need to be trained to carry out incremental growth assessment in infants. Lactational and mental support programs should be strengthened in the rural MCH systems, to assist mothers to achieve pleasant experiences with breastfeeding and newborn care. Exclusive breastfeeding should be fur t h e r promoted and this will in turn reduce the incidence of infant ill health. Home visits should be carried out for infants lost to follow up.
Keywords: Incremental and static weight assessments, Infant weight faltering, weight acceleration, exclusive breastfeeding, post-partum maternal depression score
INTRODUCTION
Growth faltering (previously known as failure to thrive) is a broad term used to describe children, who fall below their anticipated growth trajectory due to undernutrition. The term refers to static growth, or an unexpected downward trajectory and/or unexpected slower rate of weight gain from a previously established pattern of growth [1].
According to the National Instituite for Health and Care Excellence (NICE) criteria, concerns about weight faltering should be entertained, when an infant’s current body weight is below the 2nd centile for age, regardless of the birthweight.1 This definition was based on static (one-time) growth assessment, which suggests attained growth and does not include or it minimizes changes in growth trajectories over time [2]. Because infant growth is dynamic and their growth pattern is exponiential rather than linear, especially in the first 6 months of life, incremental (interval) growth assessment is more appropriate rather than static assessment in this early age group. Relying only on static growth assessment (whether one-time or serially), as it is being implemented currently, in many developing countries, could lead to under- or over-diagnosis of growth faltering in this age group. The static assessment might remain the sameover a period of time, while the incremental or interval growth assessment may reveal earlier, an accelerated, flat or decelerated growth trend [2].
According to the principles of human growth, postnatal growth occurs in discontinuous saltatory spurts with a stagnant background in between those spurts. Also growth is highly variable and maximum during early infancy, compared to other phases of postnatal human growth [3]. Small children tend to move upwards through the centiles, while large children tend to cross downwards, following the normal phenomenon of regression to the mean and conditional weight gain [4].
Growth faltering is caused primarily by inadequate feeding. Only 5-10% of cases are caused by underlying disease and another 5% caused by neglect-related issues [5]. Olusanya and Renner 6 observed that the growth assessments based on the Centers for Disease Control and Prevention (CDC) reference and t h o s e f r o m t h e World Health Organization (WHO)’s multicenter growth standards (using static one-time measures such as weight-for-length, weight-for-age and length-for-age z-scores), differred at birth and within the first three months of life among 445 full term singleton in Lagos West Africa. These authors considered weight faltering, if weight-for- age percentile was below 3. The authors reported the percentages of infants growth faltering to be 20.7% at birth and declined to 16.4% at follow-up, on any of the growth charts. LBW-born infants were significantly more likely to falter at followup [6]. Boys were more prone to weight faltering than girls. Maleta et al. observed that length faltering was present at birth and persisted for the first three years of life, while weight faltering was at its peak between 3 and 12 months of life among 767 live born babies in rural Malawi [7].
The adverse effects of early postnatal growth faltering on the developing infant have been well documented and includes subsequent persistent growth faltering, increased risk of severe infection, delay in motor, cognitive and psychomotor development, behavioural problems, learning disabilities and infant mortality, to mention a few.8 Hence, it is crucial to use valid tools to regularly and accurately assess infant growth, identify early stages of growth faltering, intervene appropriately and effectively, especially within the physiologic window of the first 1000days of life, when pathology can be reversed in this vulnerable population.
The paucity of literature on infant incremental growth assessment is an indication that health professionals in developing countries, do not routinely carry out comprehensive growth assessments. Hence, this study was designed to determine the incidence and risk factors of weight faltering and to compare both increment and static weight assessments among 512, 6 weeks old infants in a rural East African community.
Concept of the study
Figure 1, shows the maternal and neonatal determinants of infant weight faltering and acceleration, that were investigated in this study. Static and incremental weight criteria were used to measure infant growth.
Explanatory Variables Outcome Variables
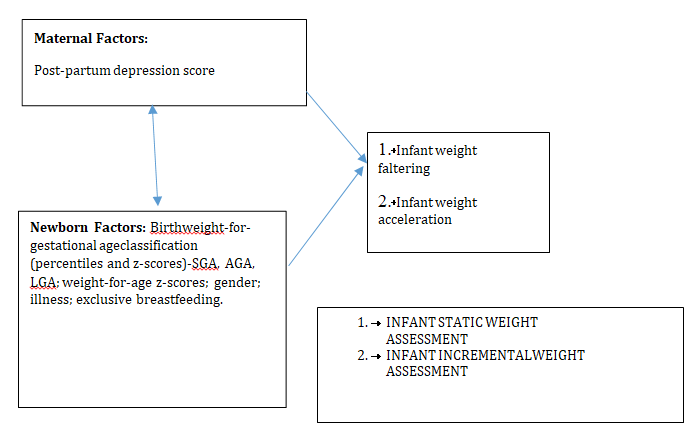
Figure 1: Concept of the study.
MATERIALS AND METHOD
The methods employed in carrying out this study are discussed in this section.
STUDY SETTING
Rwanda has an average of 4.4 persons per household. About half (48%) of its population is under 19 years of age and 39% live below the poverty line. Adult literacy rate among 15–49 years old women is about 80%. In addition, 87.3% of the population have health insurance and access to health services; spending an average of 47.4 min to reach a health centre [9].
Non-availability of regular supplies of clean and safe water, has been a longstanding problem in Rwanda, probably as a result of its landlocked and hilly terrains, making construction and supply of piped water, a major challenge. A few non-profit organizations, such as USAID and Water- for- life have sunk bore holes in strategic locations in a few number of villages in the country, with the aim of alleviating this water problem.
Gitwe village is located on a high altitude of 1,674 meters above sea level, in the southern province, 240km from Kigali, which is the capital city of Rwanda. The maximum number of deliveries at the Git we General Hospital per month was about 200 and an average of 50 infants visit the maternal and child health clinic (MCH) per day. There are only 2 immunisation days per week. Some of the challenges in the hospital include poor specialist coverage and few trained health workers, poor supply of equipment, water, electricity, laboratory services and medicines.
Challenging cases are referred to the University of Rwanda Teaching Hospital in Butare or Kigali. Gitwe village was selected for this study, because there was no published birth data from this poorly researched, remote, relatively unaccessible community. In 2019, birth and up to 9 months of age feeding and growth data on 529 healthy mother-singleton newborn pairs were compiled in this village, over a period of 12 months in the delivery, postnatal wards and clinics of Gitwe general hospital and at its annex, the MCH [9].
DATA SOURCE AND SAMPLE
This was a secondary analysis of data collected for a prospective cohort study on growth faltering over a period of 12 months, until infant was 9 months old. The sample size of 529, recruited from birth was obtained from the EpiTool sample size calculator for cohort studies [10] at a power of 80%, 11% prevalence of underweight among underfive children in Rwanda [11] and an additional 15% was added to mitigate attrition or drop out rate. Small and sick babies were excluded from the study and all mothers with a dating scan in pregnancy were recruited. Mother- newborn pairs were recruited consecutively, on first-come-first-serve basis, after consenting to the study, on arrival at the postnatal ward. Maternal file review and newborn anthropometry [weight (kg), length (cm) and head circumference (cm) measurements, their z- scores and percentiles, were recorded to the nearest decimals] were carried out, soon after birth. Newborn gestational age was determined using the record of the maternal first date of the last menstrual period (LMP), fetal ultrasound dating and/or expanded new Ballard criteria. Newborn classification into small-for-gestational age (SGA), appropraite-for-gestational age (AGA) and large-for-gestational age (LGA) was based on their weight-for-gestational age percentiles at birth, according to WHO. Weight faltering at 6 weeks post-delivery was defined by NICE static weight assessment of weight-for-age percentile of ≤ 2nd centile for age, regardless of birthweight. Weight faltering (according to NICE incremental weight faltering criteria), was considered when there was a fall across 1 or more weight centile spaces, if birthweight was below the 9th centile; when there was a fall across 2 or more weight centile spaces, if birthweight was between the 9th and 91st centiles; when there was a fall across 3 or more weight centile spaces, if birthweight was above the 91st centile. One centile space on the percentile curve was equivalent to 0.67 z- scores [1].
Weight acceleration by incremental weight assessment was documented, when the weight-for- age z-score at 6 weeks was greater than 0.67 above that of the weight-for-gestational age z-score at birth [12]. Weight-for-age z-score at birth and 6 weeks were obtained from PediTool calculator, which was based on WHO growth standards and used the infants’ corrected age [13]. Mothers were interviewed using standardized infant feeding questionnaires [14] and the Edinburgh postpartum depression questionnaire/score [15,16] at 6 weeks post-partum in the postnatal clinic. The questionnaires were read to the mothers and filled by the research assistants.
To ensure the quality of data collected, 2 registered nurses were trained as research assistants at Gitwe Hospital on the over-all procedure of mother and newborn anthropometry and data collection by the investigator. Research Training and preparations for data collection took place between 3rd of January and 21st of January 2019. The questionnaires were pre-tested before the main data collection phase, on 10 mother-infant pair participants (2% of the total sample). The investigator closely followed the day-to-day data collection process and ensured completeness and consistency of the questionnaires administered each day, before data entry.
Statistical Analysis
Data clean up, cross-checking and coding were done before analysis. These data were entered into Microsoft Excel statistical software for storage and then exported to SPSS version-26 for further analysis. Both descriptive and analytical statistical procedures were utilized. Participants’ categorical characteristics were summarised in frequencies and percentages. Chi test was used to determine association between infant characteristics and weight faltering. Numerical characteristics such as maternal depression scores were presented in median and interquartile ranges for skewed data. A binary logistic regression model was created to examine the relationships between the independent variables (maternal and neonatal characteristics) and dependent variables (weight faltering and weight acceleration) and to generate the odds ratio. Factors with p-values <0.1 were included in the regression model. Odds ratio (OR), with a 95% confidence interval (CI) were computed to assess the strength of association between independent and dependent variables. For all, statistical significance was declared at p-value <0.05. The reporting in this study were guided by the STROBE guidelines for observational studies [17].
Ethics
The Health Sciences Research Ethics Committee of the University of the Free State in South Africa gave the ethical approval for the collection of the primary data for the original study titled- ’Growth and growth faltering in a birth cohort in rural Rwanda: a longitudinal study’ with Ethical Clearance Number: UFS-HSD2018/1493/2901. Written permission to collect data was obtained from the Director of Gitwe Hospital, Rwanda. Verbal consent were obtained from eligible mothers as they were recruited consecutively from the postnatal ward after delivery, with the attending nurse as a witness. The content of the research information booklet and consent letter were read out to the mothers in their local languages and their permission were sought after ensuring that they understood the purposes, methods, pros and cons of the research. The participants were given research identity numbers and the principal investigator was responsible for the safe keeping of the completed questionnaires and collected data, to ensure anonymity and confidentiality of the participants.
RESULTS
The following are the results obtained from the study.
Participants
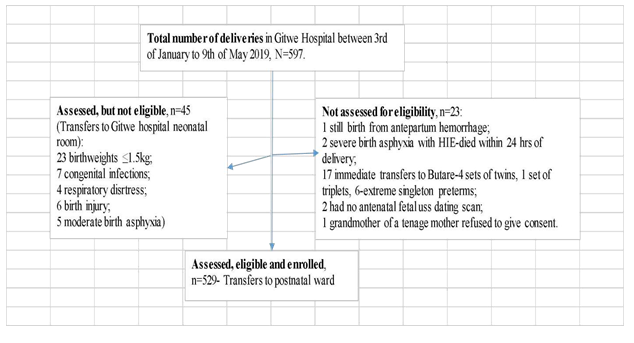 |
HIE-hypoxic ischemic encephalopathy; uss-ultrasonography.
Figure 2: Flow of participants from admission to recruitment into study.
At 6 weeks post delivery, 10 male infants (4 were born-LGA and 6 were born-AGA ) were absent at the postnatal clinic and a further 7 babies (4 girls [1 was born-LGA, 1 born-AGA and 2 were born-SGA] and 3 boys [all were born-AGA]) were excluded from the analysis because of incomplete data. Hence, growth and feeding data were collected from a total of 512 babies at 6 weeks post-delivery. There were 242 girls (47.3%) and 270 boys (52.7%) at the 6 weeks postnatal clinic.
Characteristics of babies associated with growth faltering at 6 weeks post-delivery
Overall, 16 (3.1%) out of the 512 babies were growth faltering according to static assessment in Table 1. The percentages in Table 1, shows that the girls were less likely (OR=0.36; 95% CI 0.10, 1.36) to falter in growth at 6 weeks post-delivery, compared to the boys, continuity correction p=0.204.
Three (0.6%) out of the 512 babies at 6weeks post-delivery were not exclusively breastfed. Exclusive breastfeeding rate was 99.4%. Two of these 3 babies, who were not on EBF were also offered water and the third one was cup-fed with whole cow milk. The baby who received cow milk, was also offered mashed potatoporridge. The babies who were not exclusively breastfed were more likely to falter in growth (Fisher’s exact test was <0.001; OR=99.8; 95%CI was very wide).
107 SGA-born, 370 AGA-born and 35 LGA-born out of the 512 babies were analysed in the 6 weeks data. A higher percentage (10.3%) of the SGA babies, compared to 1.1% of AGA and 2.9% of the LGA faltered in weight, p<0.001. Of note, 7 (63.6%) out of the 11 SGA-born infants growth faltering were term asymmetrically grown SGA at birth.
However, according to incremental weight assessment, only 7 (1.4%) out of the 512 babies were weight faltering:SGA 2 (1.9%) out of 107; AGA 3 (0.8%) out of 370 and LGA 2 (5.7%) out of 35. This was the reverse of weight faltering pattern documented by static assessment.
47 (9.2%) of the 512 babies were reported ill in the first 6 weeks of life. Out of these 47 babies that were reported ill, 29 (5.7%) had respiratory illnesses; 7 (1.4%) had diarrhea illnesses [4].
(0.8%) were ill because of complications due to prematurity; 2 (0.4%) had sepsis and 1 (0.2%) each had respiratory illness and diarrhea, respiratory illness and malaria, jaundice, malaria and congenital heart disease. Those, who were reported ill were 11.20 (95% CI 3.45, 36.28) times more likely to falter in weight than those who had not fallen ill.
81 (15.8%) of the 512 babies were fed 8 times or less daily. These babies were 11.70 (95% CI 3.43, 39.85) times more likely to falter in growth, compared to those who were fed more frequently.
The median depression score of the 512 mothers was 7.0 (IQR 2,8). The mothers of babies who were faltering in weight had lower median depression score (0; IQR 0, 8.75) compared to those who were thriving (7.0; IQR 2.0, 8.0). However, the non-parametric independent t test statistics was not significant for the difference in the median depression scores between the 2 groups (p=0.716). There is likely to be a type II error, due to poor sample size of babies in the weight faltering group.
Table 1: Crosstabulation of infant characteristics and weight faltering, n=512.
|
Yes (%) |
No (%) |
-100 |
||
|
Newborn classification (WHO) |
<0.001 |
11 (10.3) |
96 (89.7) |
107 |
|
Small-for-gestational age |
||||
|
Appropriate-for-gestational age |
4 (1.1) |
366 (98.9) |
370 |
|
|
Large-for-gestational age |
1 (2.9) |
34 (97.1) |
35 |
|
|
Sex |
######### |
|||
|
Female |
3(1.2) |
239(98.8) |
242 |
|
|
Male |
9(3.3) |
261(96.7) |
270 |
|
|
Exclusive breastfeeding |
<0.001 |
|||
|
No |
2 (66.7) |
1 (33.3) |
3 |
|
|
Yes |
10 (2.0) |
499 (98.0) |
509 |
|
|
Ill |
<0.001 |
|||
|
Yes |
6 (12.8) |
41 (87.2) 459 (98.7) 496 (96.9) |
47 |
|
|
No |
6 (1.3) |
465 |
||
|
Total |
16 (3.1) |
512(100.0) |
||
Growth Acceleration at 6 Weeks Post-delivery
When the infants were assessed for incremental growth, a higher percentage (81.3%) of the SGA babies, compared to the AGAs and LGAs were experiencing weight acceleration at 6 weeks post-delivery, p<0.001. Of note, the 78 (89.7%) out of the 87 SGA-born infants, growth accelerating at 6 weeks post-delivery, were symmetrically grown SGAs at birth. Only 6 (17.1%) of the LGA infants were growth accelerating, Table 2.
Table 2: Relationship between birth size and weight acceleration at 6 weeks post-delivery, n=512, p<0.001.
|
|
Increment growth |
Total |
||
|
Total Not accelerating |
Accelerating |
|||
|
|
(%) |
(%) |
|
|
|
SGA |
|
20 (18.7) |
87 (81.3) |
107 (100.0) |
|
AGA |
|
121 (32.7) |
249 (67.3) |
370 (100.0) |
|
LGA |
|
29 (82.9) |
6 (17.1) |
35 (100.0) |
|
|
Total |
170 (33.2) |
342 (66.8) |
512 (100.0) |
Binary Logistic Regression Analysis of Factors Associated With Infant Weight Acceleration
The strongest factor was the birth size; the bigger the infant was at birth, the less likely the infant will weight accelerate at 6 weeks post-delivery; Wald 37.31, p<0.001. The LGA-born infant was the least likely to weight accelerate, compared to the SGA-born and AGA-born infants; OR 0.04; 95% CI 0.01, 0.10. High maternal depression score was associated with infant weight acceleration, Wald 14.37; p<0.001; OR 1.13; 95% CI 1.06, 1.21. Boys were less likely to weight
accelerate compared to girls, p<0.001; Wald 12.94; OR 0.45; 95% CI 0.29, 0.70. Babies, who were adequately fed were more likely to weight accelerate compared to those who were poorly fed, Wald 11.62; p<0.001; OR 2.80; 95% CI 1.55, 5.05. Babies, who did not fall ill since birth were more likely to weight accelerate compared to those who had fallen ill, Wald 8.21; p=0.004; OR 2.73; 95% CI 1.37, 5.43.
Table 3: Binary regression analysis of infant characteristics and weight acceleration, n=512.
|
B |
S.E. |
Wald |
p-value |
OR |
95% C.I. |
for OR |
||
|
Step 1a |
Adequate feeding |
1.03 |
0.3 |
11.62 |
0.001 |
2.8 |
Lower |
Upper |
|
1.55 |
5.05 |
|||||||
|
frequency Not ill |
||||||||
|
1.01 |
0.35 |
8.21 |
0.004 |
2.73 |
1.37 |
5.43 |
||
|
SGA |
37.31 |
0 |
||||||
|
AGA |
-0.92 |
0.31 |
8.91 |
0.003 |
0.4 |
0.22 |
0.73 |
|
|
LGA |
-3.33 |
0.55 |
37.31 |
0 |
0.04 |
0.01 |
0.1 |
|
|
Male |
-0.8 |
0.22 |
12.94 |
0 |
0.45 |
0.29 |
0.7 |
|
|
Depression score |
0.12 |
0.03 |
14.37 |
0 |
1.13 |
1.06 |
1.21 |
|
|
Constant |
-0.27 |
0.45 |
0.38 |
0.54 |
0.76 |
Comparing Static and Incremental Infant Growth Assessment
Conducting a Chi test using a 2 × 2 table, Fisher’s exact test was <0.001, suggesting a significant difference in the distribution of weight faltering in the findings of the 2 weight assessment methods (incremental vs static). McNemar test was significant at 0.022. Cohen Kappa measure of agreement between the 2 methods of weight assessment was moderate (0.424) and significant (p<0.001).
Table 4: Comparing incremental infant weight assessment to static infant growth assessment.
|
|
Static infant weight Faltering (%) |
assessment Thriving (%) |
Total |
|
|
Incremental |
Faltering |
5 (71.4) |
2 (28.6) |
7 |
|
infant weight |
Thriving |
11 (2.2%) |
494 (97.8%) |
505 |
|
assessment Total |
|
16 (3.1) |
496 (96.9) |
512 |
DISCUSSION
This study estimated the incidence of weight faltering (based on both static and incremental weight assessment methods) among 512 infants, who were presented at the 6 weeks post-natal clinic. In addition, risk factors of postnatal weight faltering were identified and the 2 methods of weight assessment were compared. Of note, 10 infants out of the original 529 participants recruited from birth, were absent at the 6 weeks postnatal clinic. Exclusive breastfeeding rate was 99.4% at 6 weeks post delivery in this cohort. This Exclusive Breastfeeding rate was significantly higher than the 59.2% average recorded for infants 0-5months of age in the East African region, according to the 2022 Global Nutrition report [18].
The difficulties in obtaining a robust literature search on growth faltering among infants less than six months of age, suggests that this age group has not received adequate attention from a prevention, timely detection and management perspective [19]. One of the reasons, for this lack of attention, is inconclusive evidence on the most robust anthropometric parameters for identification of growth failure in these young infants. However, weight-for-age Z (WAZ), which is a static assessment, has been suggested to be the best predictor of mortality among infants less than six months of age [19,20]. Using growth parameters that encompasses body length, could lead to the age of 6 months, because of their flexed posture at rest. These criteria were similar to those used in this study [12].
The pattern of weight faltering observed in this study, also differed with both static and incremental assessment methods. On the static assessment platform, the SGA-born infants were more inclined to weight faltering, while on the incremental assessment method, the SGA infants were found to be weight accelerating the most, compared to the AGA and LGA infants. The least accelerating group of infants in this study were the LGAs. This finding was in line with the principles of conditional weight gain, whereby the bigger babies tend to grow more slowly than the smaller sized babies from birth [4]. Therefore, using only the static assessment method, could lead to increased tendency of SGA-born infants being mislabelled as weight faltering, aggressively fed and subsequently developing metabolic problems later in life. The pathological weight faltering LGA infant is also likely to be missed [4]. In a systematic review by Campisi et al in 2010. [23]. It was out of this birth cohort, that this 6 weeks post-delivery data was derived as they presented in the immunisation clinic in Gitwe.
A small percentage (0.6%) of infants in this study were not exclusively breastfed. As such infants who were not adequately fed, not on exclusive breastfeeding, boys and those who fell ill were at increased risk of weight faltering. The birth size was also a significant determinant of infant growth at 6 weeks of life [6].
Pellowski et al. [24] observed a progressive decline in maternal median depressive symptom score from 9 [IQR: 6, 12] during pregnancy, to 8 [IQR: 5, 11] at both 10 weeks and 6 months postpartum, to 7 [IQR: 3.5, 11] at 12 months postpartum and then to 6 [IQR: 0,8] at 18 months postpartum, in South Africa. Though, the maternal depression scores in this study were lower compared to the South African study, the decline in maternal median depression symptom score from birth [7.0 (IQR 3,9)] to 6 weeks post-partum [7.0 (IQR 2,8)] in this Rwanda cohort study was not as pronounced [22,24,25]. There is a strong link between stressful life events (which may include difficulties with lactation and newborn care) and maternal depression. It appears these mothers were still struggling with these challenges at 6 weeks post-delivery from birth. This calls for strengthening of lactational and mental support for women in this community.
One of the limitations in this study was the loss to follow up of infants at the MCH clinic. Also, excluding small and sick babies from the study, could have falsely depleted the infant weight faltering rate in the cohort. The authors recognise the variety of definitions of infant growth faltering and catch-up growth employed in other studies, as there is no global consensus yet on the standard definitions of same for infants below the age of 6 months. As such, infant length was not utilised in assessing growth in this study, because of the challenges surrounding length measurement in this assessing growth in this study, because of the challenges surrounding length measurement in this age group.
CONCLUSION
This study emphasizes the importance of assessing infant growth using both static and incremental measures to avoid mislabelling or missing infants with growth faltering. Health workers need to be trained to carry out incremental growth assessment in infants. Lactational and mental support programs should be strengthened in the rural MCH systems, to assist mothers to achieve pleasant experiences with breastfeeding and newborn care. Exclusive breastfeeding should be encouraged and this will in turn reduce the incidence of infant ill health. Home visits should be carried out for infants lost to follow up.
REFERENCES
- National Institute of Clinical Excellence (NICE). (2017.). Faltering growth—recognition and management of faltering growth in children. 2017. Contract No:75.
- Naumenko DJ, Dykes J, O'Connor GK, Stanley Z, Affara N, Doel AM, et al. (2021). A Novel method for the identification and quantification of weight faltering. Am J Phys Anthropol. 175(1):282-291.
- Balasundaram P, Avulakunta ID. (2023). Human Growth and Development. [Updated 2023 Mar 8]. In: StatPearls [Internet]. Treasure Island (FL): StatPearls Publishing.
- Olsen EM, Petersen J, Skovgaard AM, Weile B, Jørgensen T, Wright CM. (2007). Failure to thrive: the prevalence and concurrence of anthropometric criteria in a general infant population. Arch Dis Child. 92(2):109-114.
- Shields B, Wacogne I, Wright CM. (2012). Weight faltering and failure to thrive in infancy and early childhood. BMJ. 345:e5931.
- Olusanya BO, Renner JK. (2013). Pattern and characteristics of growth faltering in early infancy in an urban sub-Saharan African setting. Pediatr Neonatol. 54(2):119-127.
- Maleta K, Virtanen S, Espo M, Kulmala T, Ashorn P. (2003). Timing of growth faltering in rural Malawi. Arch Dis Child. 88:574-578.
- Black RE, Allen LH, Bhutta ZA, Caulfield LE, De Onis M, Ezzati M, et al. (2008). Maternal and child undernutrition: global and regional exposures and health consequences. Lancet. 371(9608):243-260.
- Rwanda, Ministry of Health and National Instituite of Statistics. (2020). Key Indicators Report. Rwanda Demographic and Health Survey. DHS programme; 1-55. Available online at: https://dhsprogram.com/method.
- EPITOOLS. Sample size for a Cohort study. https://epitools.ausvet.com.au/cohortss
- BUCYANA JEAN JACQUES SOUVENIR. (2015). Prevalence and causes of child malnutrition in Rwanda. https://www.academia.edu/16435021/Prevalence_and_causes_of_child_malnutrition_in_Rwanda
- Sithamparapillai K, Samaranayake D, Wickramasinghe VP. (2022). Timing and pattern of growth faltering in children up-to 18 months of age and the associated feeding practices in an urban setting of Sri Lanka. BMC Pediatr. 22(1):190.
- Chou JH, Roumiantsev S, Singh R. (2020). PediTools Electronic Growth Chart Calculators: Applications in Clinical Care, Research, and Quality Improvement. J Med Internet Res. 22(1):e16204.
- QUESTIONNAIRES.https://resourcecentre.savethechildren.net/pdf/b._generic_iycf_questionnaire. pdf/
- Stanford Medicine. Edinburgh Postnatal Depression Scale (EPDS).https://med.stanford.edu/content/dam/sm/ppc/documents/DBP/EDPS_text_added.pdf
- Levis B, Negeri Z, Sun Y, Benedetti A, Thombs BD. (2020). Accuracy of the Edinburgh Postnatal Depression Scale (EPDS) for screening to detect major depression among pregnant and postpartum women: systematic review and meta-analysis of individual participant data. BMJ 371:m4022.
- Ev E, Altman DG, Egger M, Pocock SJ, Gøtzsche PC, Vandenbroucke JP. (2007). Strengthening the reporting of observational studies in epidemiology (STROBE) statement: guidelines for reporting observational studies. BMJ. 335(7624):806–8088.
- Global Nutrition Report. (2022). Country Nutrition Profileshttps://globalnutritionreport.org/resources/nutrition-profiles/africa/eastern-africa/
- ICF, IIPS. (2017). India National Family Health Survey NFHS-4 2015–16. Mumbai, India: IIPS and ICF. 2017.
- Ross ES, Krebs NF, Shroyer AL, Dickinson LM, Barrett PH, Johnson SL. (2009). Early growth faltering in healthy term infants predicts longitudinal growth. Early Hum Dev. 85(9):583-588.
- Campisi SC, Carbone SE, Zlotkin S. (2019). Catch-Up Growth in Full-Term Small for Gestational Age Infants: A Systematic Review. Adv Nutr. 10(1):104–111.
- Ogah AO, Pandey VK, Kawatu N, Kapasa M, Pius S. (2023). Magnitude and Determinants of Delayed Breastfeeding Initiation among Mothers who Delivered by Cesarean Section in a Rural General Hospital in East Africa. J Perinatal Neonatal Care. 3(2):1-18.
- Lee AC, Katz J, Blencowe H, Cousens S, Kozuki N, Vogel JP, et al. (2013). National and regional estimates of term and preterm babies born small for gestational age in 138 low-income and middle-income countries in 2010. Lancet Glob Health. 1(1):e26–e36.
- Pellowski JA, Bengtson AM, Barnett W, DiClemente K, Koen N, Zar HJ, et al. (2019). Perinatal depression among mothers in a South African birth cohort study: Trajectories from pregnancy to 18 months postpartum. J Affect Disord. 259:279-287.
- Ogah AO, Ogah, JAO. (2023). Another Perspective on The Relationship Between Breastfeeding, Newborn Care and Maternal Perinatal Depression In A Rural African Setting.